Description
Dephpugger is an open source lib to make a debug in php direct in terminal, without necessary configure an IDE. The dephpugger run in Php Built in Server using another command. You can use for:
Dephpugger alternatives and similar libraries
Based on the "Debugging and Profiling" category.
Alternatively, view Dephpugger alternatives based on common mentions on social networks and blogs.
-
XHProf
XHProf is a function-level hierarchical profiler for PHP and has a simple HTML based user interface. -
Tracy
😎 Tracy: the addictive tool to ease debugging PHP code for cool developers. Friendly design, logging, profiler, advanced features like debugging AJAX calls or CLI support. You will love it.
InfluxDB - Power Real-Time Data Analytics at Scale

* Code Quality Rankings and insights are calculated and provided by Lumnify.
They vary from L1 to L5 with "L5" being the highest.
Do you think we are missing an alternative of Dephpugger or a related project?
README
What is Dephpugger?
Dephpugger (read depugger) is an open source lib to make a debug in php direct in terminal, without necessary configure an IDE. The dephpugger run in Php Built in Server using another command. You can use for:
Web applications
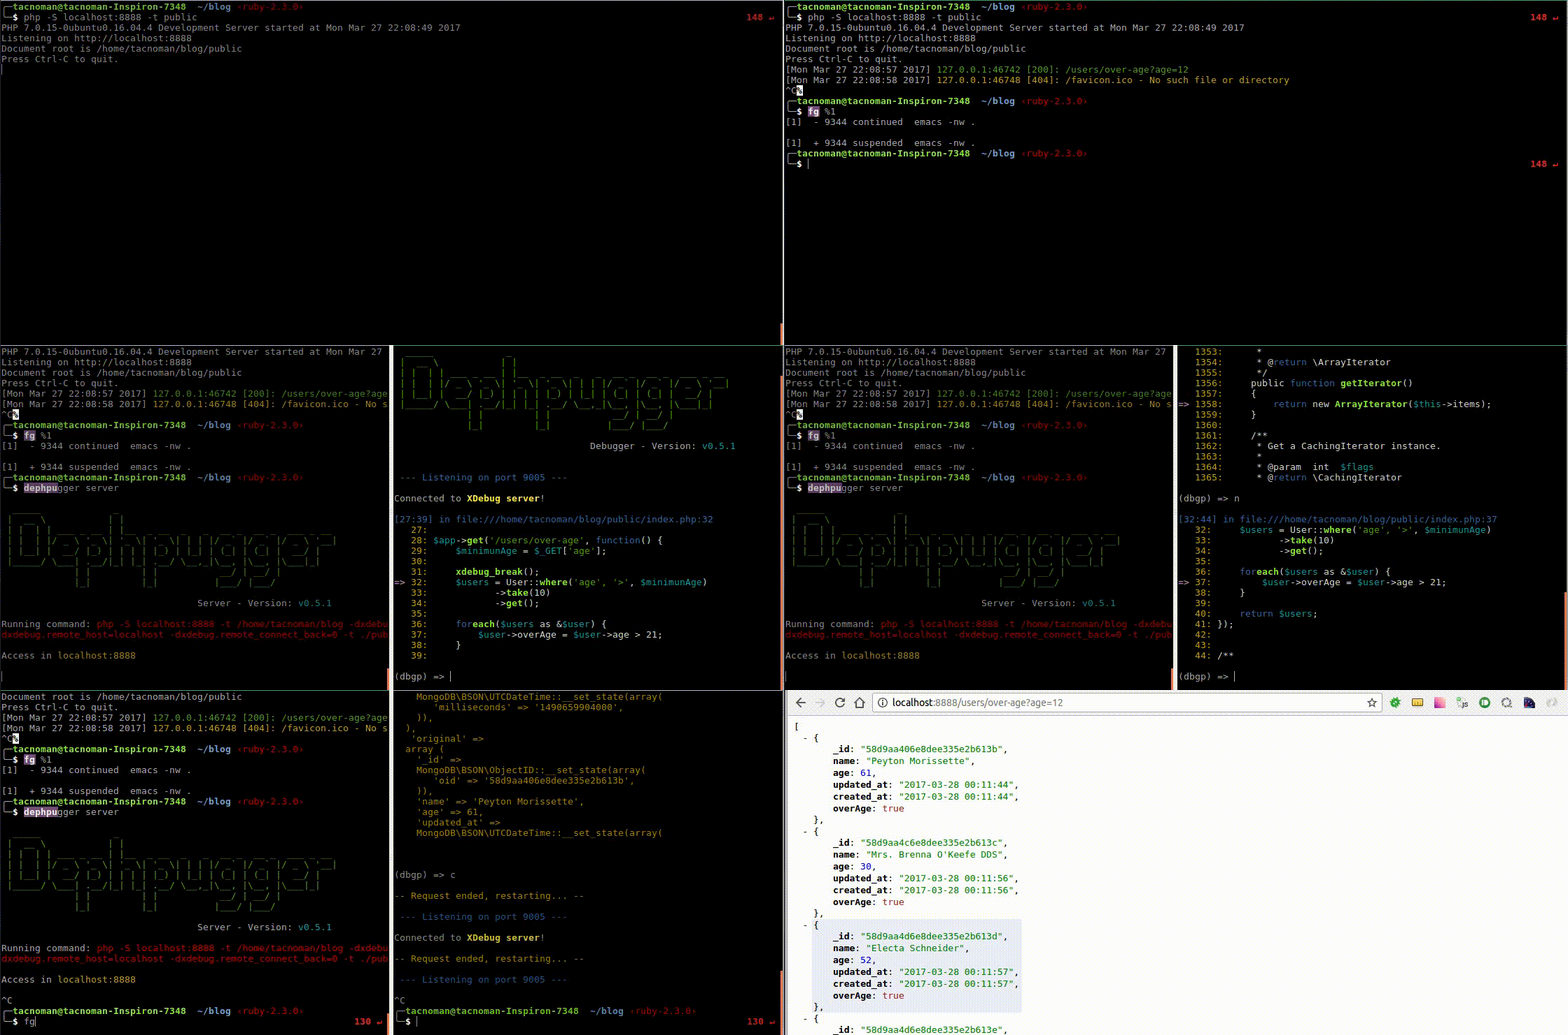
Lumen in example

Image 1.0 - Screenrecord for debug web
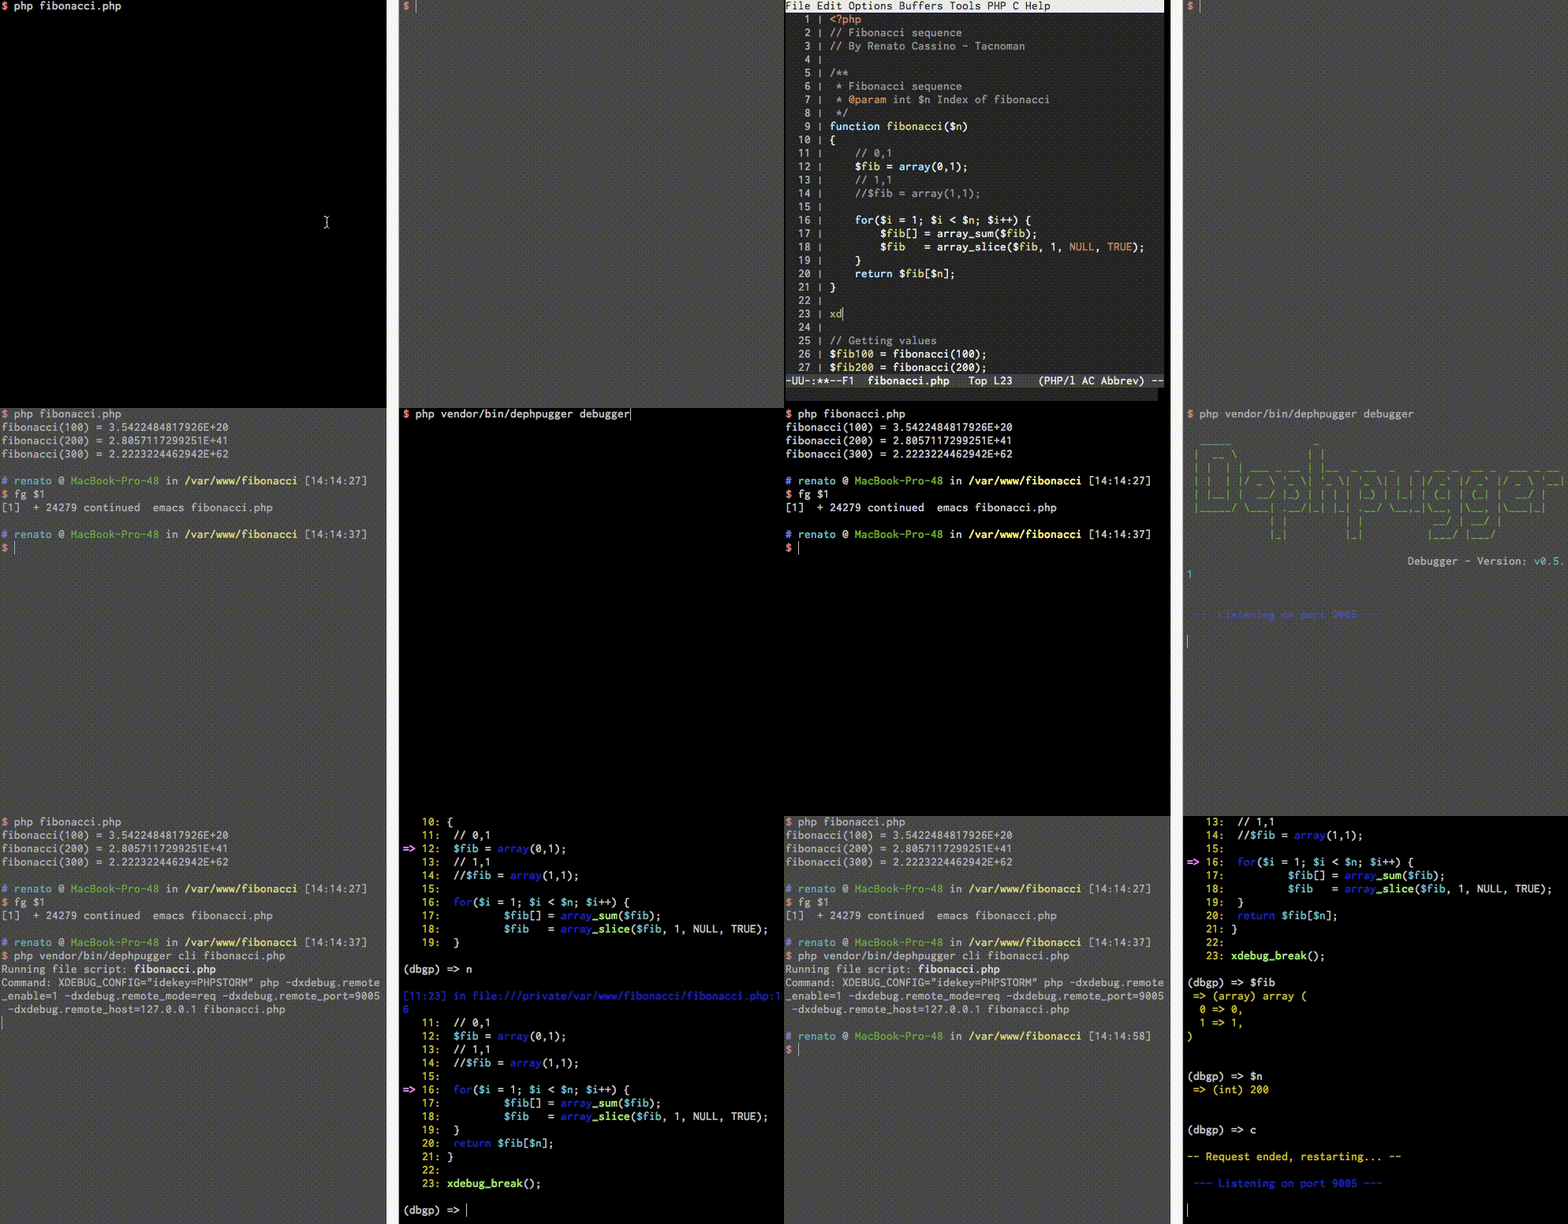
Cli Scripts

Image 1.1 - Screenrecord for debug cli scripts
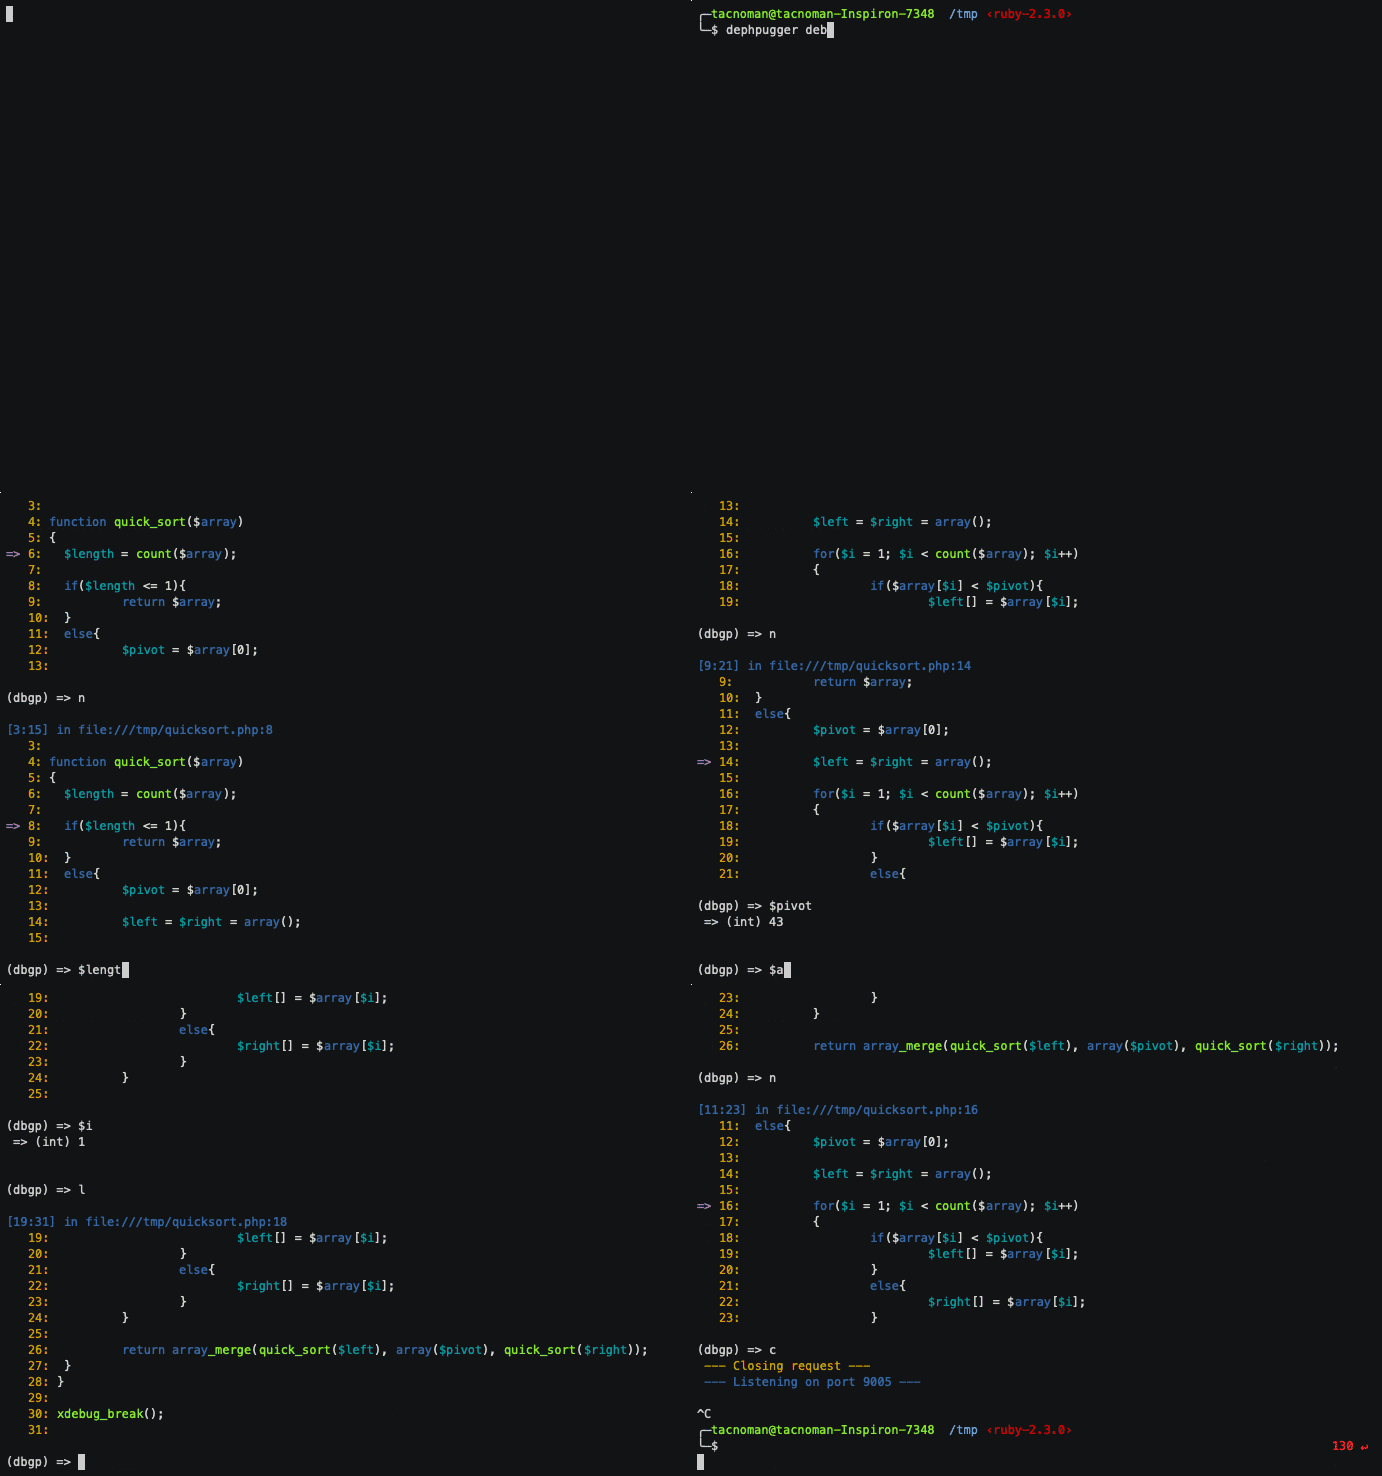
Another example

Install
To install you must run this code (using the composer).
$ composer require tacnoman/dephpugger
Install globally
In Linux or Mac Os X
Run this command:
$ composer global require tacnoman/dephpugger
And add in your ~/.bash_profile.
export PATH=$PATH:$HOME/.config/composer/vendor/bin
Now, run source ~/.bash_profile and you can run the commands using only $ dephpugger.
In Windows
Sorry for this :/ I don't have Windos SO to run the Dephpugger, but I'm waiting your Pull Request to solve this ;D
But you can use Docker
Using phar file
$ wget https://raw.githubusercontent.com/tacnoman/dephpugger/master/dephpugger.phar -O dephpugger
$ chmod +x ./dephpugger
$ mv ./dephpugger /usr/local/bin/dephpugger
Or installing via curl
$ curl https://raw.githubusercontent.com/tacnoman/dephpugger/master/installer.sh | bash
Install XDebug
To install XDebug in Linux you must run:
$ sudo apt-get install php-7.2-cli php-dev php-pear
$ sudo pecl install xdebug
Find the last line, similar to: You should add "zend_extension=/usr/lib/php/20170718/xdebug.so" to php.ini and
copy to your php.ini file. To get the php.ini file, you can run:
$ php --info | grep php.ini

Configuration File (php.ini) Path => /etc/php/7.2/cli
Loaded Configuration File => /etc/php/7.2/cli/php.ini
Copy the zend_extension=/usr/lib/php/20170718/xdebug.so to last line in /etc/php/7.2/cli/php.ini.
Docker
$ docker run --rm -p 8888:8888 tacnoman/dephpugger:latest server
Dependencies
- PHP 7.0 or more (not tested in older versions)
- Xdebug activate
- A Plugin for your browser (If you want to debug a web application)
Plugins for
You can run this commands to check your dependencies:
$ vendor/bin/dephpugger requirements
$ vendor/bin/dephpugger info # To get all values setted in xDebug

# Or in global

$ dephpugger requirements
$ dephpugger info
Usage
To usage you must (after installation) run two binaries in vendor/bin folder.
$ php vendor/bin/dephpugger debugger # Debugger waiting debug
$ php vendor/bin/dephpugger server   # Server running in port 8888

# Or in global

$ dephpugger debugger
$ dephpugger server
You must run in two different tabs (in next version you'll can run in an uniq tab). After run theese commands, you need to put the follow line in your code:
<?php
# ...
xdebug_break(); # This code is a breakpoint like ipdb in Python and Byebug in Ruby
# ....
Now, you can open in your browser the page (localhost:8888/[yourPage.php]). When you request this page your terminal will start in breakpoint (like the image 1.0).
To debugger a php script, you could run:
$ php vendor/bin/dephpugger cli myJob.php

# Or in global

$ dephpugger cli myJob.php
Comands after run
When you stop in a breakpoint you can make theese commands:
| Command | Alias | Explanation |
|---|---|---|
| next | n | To run a step over in code |
| step | s | To run a step into in code |
| set <cmd>:<value> | Change verboseMode or lineOffset in runtime | |
| continue | c | To continue script until found another breakpoint or finish the code |
| list | l | Show next lines in script |
| list-previous | lp | Show previous lines in script |
| help | h | Show help instructions |
| $variable | Get a value from a variable | |
| $variable = 33 | Set a variable | |
| my_function() | Call a function | |
| dbgp(<command>) | To run a command in dbgp | |
| quit | q | Exit the debugger |
Configuration (is simple)
The Dephpugger project has default options like a port, host, socket port, etc. You can change this values adding a file .dephpugger.yml in root directory project.
You can create in your .dephpugger.yml file the configurations. Like this:
---
debugger:
  host: mysocket.dev # default: 0.0.0.0
  port: 9002 # default: 9005
  lineOffset: 10 # default: 6
  verboseMode: false # default: false
  historyFile: ~/.dephpugger_history # default: .dephpugger_history
server:
  host: myproject.dev # default: 0.0.0.0
  port: 8080 # default: 8888
  path: ./public/ # default: null
  file: index.php # default: null
Theese values will replace the default configuration.
Full documentation
To see the full documentation click here.
How to use with phpunit, behat, codeception and others
The documentation to use, click here.
Run tests
$ composer test
$ composer lint
Bugs?
Send me an email or open an issue:
Renato Cassino - Tacnoman - <[email protected]>
Articles and Videos
*Note that all licence references and agreements mentioned in the Dephpugger README section above
are relevant to that project's source code only.


